


In most store chains, maintenance spending is tracked as a single line: it is totaled at month end, compared with budget and filed away. When margins tighten, the real question is not how big the total is but which branch costs more than it should, and why.
This article explains how to define maintenance cost per branch, which denominators to compare it against and how to turn the gaps you find into decisions. It aims to give retail managers, investors and store teams a measurement framework they can put to work.
Why does maintenance come under scrutiny when margins tighten?
A retailer has fewer levers to pull. Rent, payroll and energy are largely set from outside, which makes maintenance one of the few cost lines that can actually be managed.
According to TurkStat (TÜİK), consumer prices in Türkiye rose 29.77% year on year in October 2026. The gross minimum wage rose 27% to 33,030 Turkish lira (TL) in 2026; depending on incentives and risk group, the monthly cost to the employer is roughly 39,000–41,000 TL. Revenue is not keeping pace. ECE Türkiye’s portfolio data shows shopping-mall revenue grew about 30% in the first eight months of 2026, while average inflation over the same period was 31.68%. In other words, revenue grew in nominal terms but shrank in real terms.
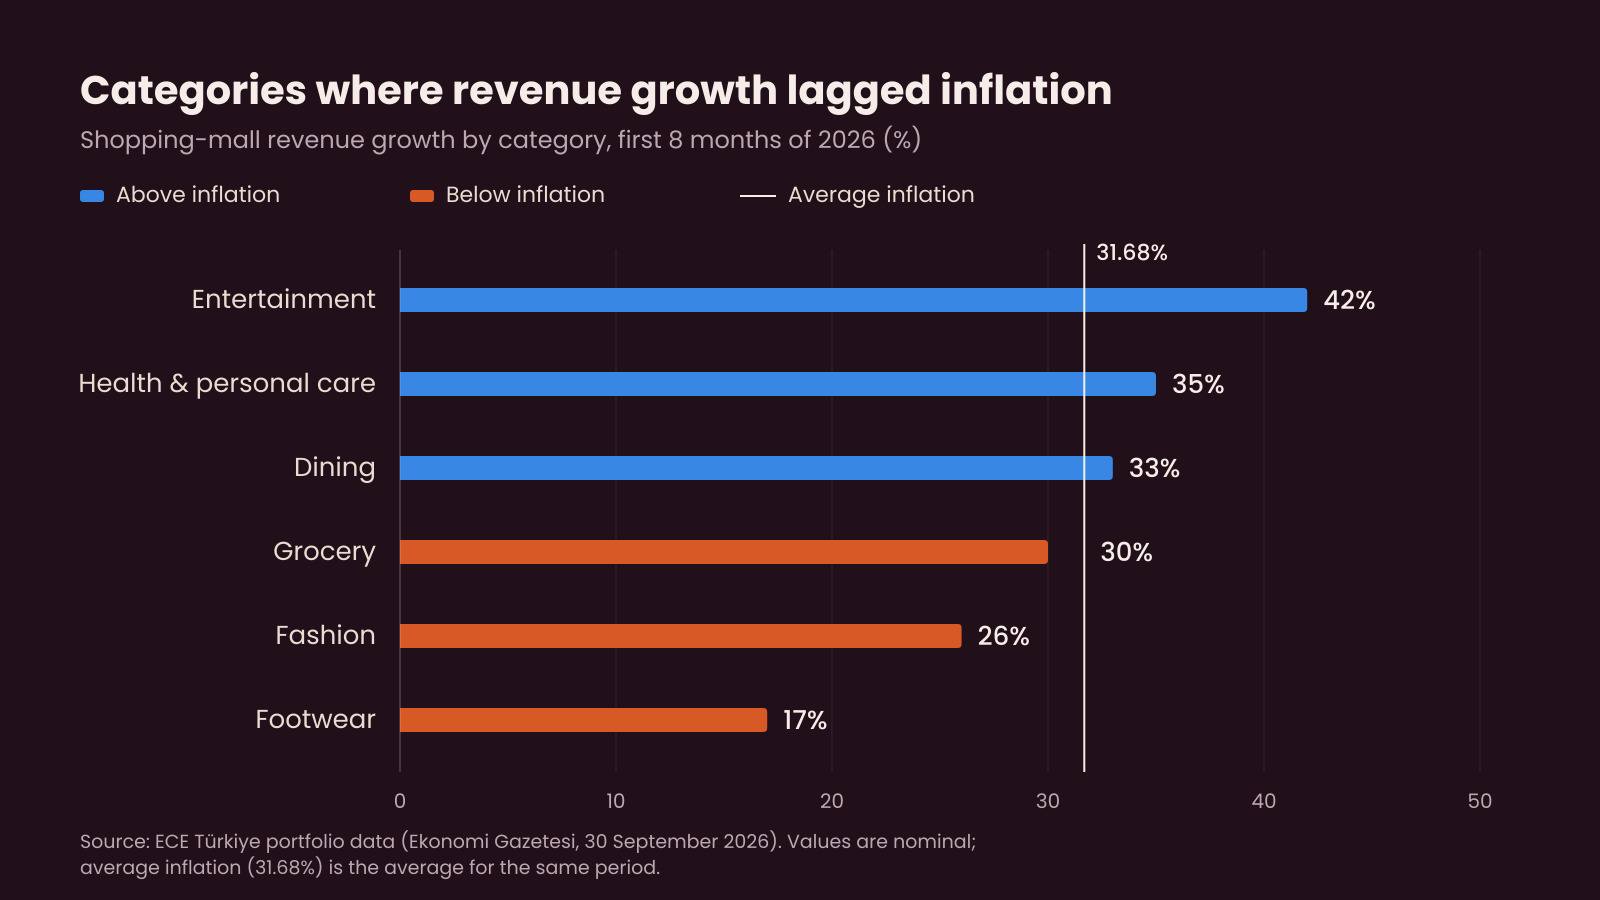
The industry’s response points the same way. Nuri Şapkacı, chairman of the Shopping Centers and Investors Association (AYD), says that closing underperforming stores or reducing their floor area may come onto the agenda, and that every store needs to be analyzed individually. İş Yatırım’s retail report cites rising rents, higher per-store investment and maintenance spending, and tighter cost discipline as reasons for the slowdown in store openings.
In this environment, “total maintenance spend” is not a sufficient indicator. To see which branch is eroding store economics, you need a normalized, branch-level measure.
What does “maintenance cost per branch” include?
The definition is simple: everything a branch spends in a given period to keep the building, the equipment and the shopping environment running. The difficulty is deciding what belongs in that total.
Direct items
- Planned maintenance: periodic checks of HVAC, refrigeration, electrical and fire systems
- Breakdown repairs and emergency call-outs
- Contractor labor, spare parts and materials
- Minor repairs and work that keeps the store looking right
Hidden items
- Downtime and lost sales: a failed refrigeration unit, air conditioner or lighting circuit slows the store down
- Extra cost from repeat visits
- Time store staff spend chasing faults
- Higher energy use from poorly maintained equipment
Most of these items do not show up on an invoice today. You do not need to calculate all of them on day one, but do add fields to your work-order record so the data can be captured.
Separate capital investment from maintenance
Renovations, new installations and store-opening spending are capital expenditure. If they end up in the same figure, a freshly renovated branch looks “expensive” and a branch whose maintenance has been deferred for years looks “cheap”. Track the two separately.
A raw number misleads: normalize it
Comparing the total maintenance spend of a 400-square-meter store with that of a 1,200-square-meter store is meaningless. Nexdigm’s retail procurement benchmarking note likewise recommends building comparable measures such as cost per square meter, per operating hour and per branch. APQC defines a standard measure for retail maintenance and operating cost per square foot.
| Indicator | Formula | What it tells you | Watch out for |
|---|---|---|---|
| Cost / m² | Maintenance spend for the period ÷ sales area | Cost intensity, independent of size | Group mall and street-front formats separately |
| Cost / operating hour | Maintenance spend ÷ hours open | Fair comparison of long- and short-hours branches | Cooling load is not proportional to hours |
| Maintenance spend / revenue | Maintenance spend ÷ net sales | Ties directly to margin | The ratio distorts when revenue swings |
| Cost / asset | Maintenance spend ÷ number of active assets | For equipment-heavy formats | The asset inventory must be current |
A hypothetical example: Branch A (400 m²) reports 60,000 TL of maintenance spend a month, and Branch B (1,200 m²) reports 150,000 TL. On totals, B looks expensive. Per square meter, though, A costs 150 TL and B costs 125 TL; as a share of revenue, A is at 2.0% (3 million TL of monthly revenue) and B at 1.25% (12 million TL). The problem branch is the small one.
Account for inflation
When annual inflation runs around 30%, a cost per square meter that rose from 100 TL last year to 130 TL this year is not a real increase. Make comparisons in constant prices or index them to CPI. Otherwise every branch looks “more expensive” and the real outliers get lost in the noise.
Five indicators: a measurement framework
A cost figure shows the outcome, not the cause. To see the cause, a four-step flow and five indicators are enough.
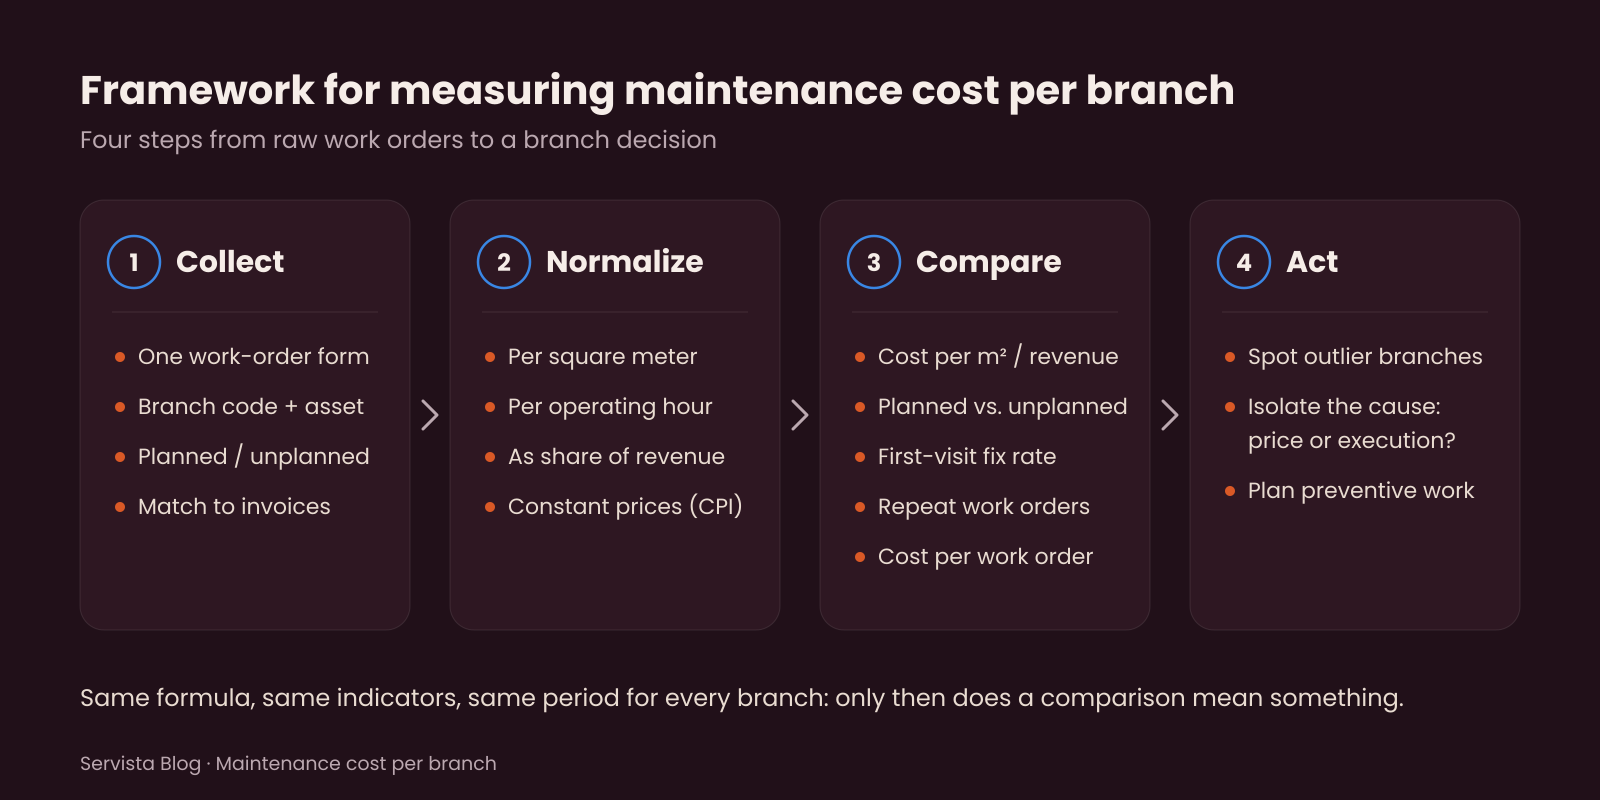
1. Cost per square meter and as a share of revenue
These are the two core indicators in the table above. Group branches by format, size and building age, and calculate the median for each group.
2. Planned vs. unplanned maintenance ratio
This shows how much of the total work was planned in advance. Industry sources often cite a target of at least 70% planned and at most 30% unplanned work (Vixxo, CAPS Group). The reason is that emergency calls bring overtime, rush parts procurement and repeat visits.
How many times more expensive unplanned work is than planned work depends on the source: a Europe-focused retail maintenance article (CAPS Group) gives 2–3 times, while the US facilities services provider Vixxo gives 3–9 times. The direction is the same; the multiplier should be verified against your own data.
3. First-visit fix rate
The percentage of faults closed on the technician’s first visit. According to Vixxo, many multi-site brands sit in the 55–70% range, and the best programs reach 85% or more. In its own study covering more than 3.75 million work orders, the same source reports that a low first-visit fix rate raises spend per work order by 10–40%. The study’s method is not published; the direction is still worth testing on your own data.
4. Repeat work-order rate
The share of work orders reopened on the same asset within a short window, say 30 days. In one Vixxo analysis of a retail portfolio, more than 23% of reactive repairs recurred within 30 days, and the finding was read as an asset-management problem, not a pricing one. Repetition is the clearest sign that nobody has touched the root cause.
5. Cost per work order and work-order volume
Volume matters as much as unit cost. Vixxo writes that the number of work orders has a strong relationship with total facility spend, often a stronger one than cost per work order. Cheap work that arrives often can cost more than expensive work that arrives rarely.
How to read the scorecard: a hypothetical example
Imagine placing four indicators for five branches of the same format (mall) side by side. The figures are hypothetical.
| Branch | m² | Cost / m² (TL, monthly) | Unplanned share | First-visit fix | Repeat work orders |
|---|---|---|---|---|---|
| A | 400 | 150 | 45% | 62% | 21% |
| B | 1,200 | 125 | 28% | 83% | 9% |
| C | 650 | 118 | 31% | 80% | 11% |
| D | 800 | 140 | 36% | 74% | 14% |
| E | 500 | 132 | 30% | 79% | 10% |
| Group median | 132 | 31% | 79% | 11% |
Branch A is about 14% above the median on cost per square meter, but the real information is in the other columns. Its unplanned share, repeat rate and first-visit fix rate are all clearly worse than the median. This pattern suggests the problem is execution, not price: look first at its work-order records and contractor performance. Branch D does not raise an alarm on its own but should go on a watch list.
External benchmarks: how far should you trust the numbers?
Most of the international figures in this article come from facility service providers in the US and Europe. They sell services, so they present their data in their own way, and on top of that come differences in exchange rates, rent structures, labor costs and climate. Read these numbers as a direction indicator, not a target.
A more reliable comparison is an internal one: compare branches of the same format and size, find the median and flag those clearly above it.
An example reported by Vixxo shows the logic well. In a multi-site retail portfolio, annual maintenance spend per branch exceeded $37,000 against a benchmark of $27,000 (about 37% higher), and cost per work order was 12% higher. Hourly rates were competitive. The problem lay in unverified labor hours, overlapping work orders and repeats that never reached the root cause: execution, not price.
From measurement to decision: what to do about outlier branches
Isolate the cause first
For a branch above the median, rule out four possibilities in turn: building and equipment age, contractor pricing, execution quality (repeat visits, unverified hours) and maintenance deferred for years. The fix is different for each, and switching contractors or cutting the budget without knowing the cause usually just moves the problem.
Contractor and invoice discipline
Response time for critical faults (for example 2–4 hours) and resolution time should be written into the contract, with performance tied to those times. Invoices should be matched to work orders, and labor hours, material lines and visit fees verified. Every work order must carry a branch code; a work order without one cannot be measured.
Track preventive maintenance like an investment
In one supplier analysis, portfolios with a structured preventive maintenance program saw repair volume fall 35–40% over three years. The figure is US data, but the logic is universal: deferred maintenance does not disappear, it comes back as a more expensive failure. Measure the effect over a three-year horizon, not one or two quarters.
The store team’s role: the first link in the measurement chain
The quality of the indicators depends on the record made by whoever first notices the fault. Asking the store team for three things is enough:
- The right asset and time. Which equipment, when, what symptom? “The cooler is broken” and “cooler 3 has been above 8 degrees since 2 p.m.” are not the same record.
- Impact on sales. Did an aisle close, did a till stop, were customers affected? This information makes downtime cost visible.
- Closure confirmation. Was the fault really fixed on the first visit? The team’s confirmation is the only source that can validate the first-visit fix rate.
When the team sees what the record is for, data quality rises. Share the scorecard with the store, and use it as a shared maintenance calendar, not as a penalty tool.
Through an investor’s or analyst’s eyes: what to look for
Most companies do not report maintenance spend as a separate line, so this measure is not directly visible from the outside. Three questions still give indirect clues about maintenance discipline:
- Is operating expense per store rising slower or faster than inflation?
- In newly opened or renovated stores, are investment and maintenance burdens growing in line with revenue?
- In closed or downsized branches, was a backlog of deferred maintenance part of the problem, or only revenue?
In a period of shrinking profit margins, the answers to these questions show a company’s cost control before the numbers do.
Common mistakes
- Looking only at totals. A figure not adjusted for branch size and format gives no basis for comparison.
- Mixing investment and maintenance. Renovation spending distorts the indicator set.
- Ignoring inflation. A nominal TL increase is not a real increase.
- Putting different formats in the same pool. Mall, street-front and grocery branches have different cost structures.
- Trying to cut cost by cutting maintenance. The figure improves in the short run, and the unplanned share rises again next quarter.
A 90-day starter plan
- Days 1–30, data. Define a single work-order template. Every record should carry the branch code, asset, planned/unplanned flag, closure status and invoice number. Match the last 12 months of invoices to branches.
- Days 31–60, normalization. Add the square meter, operating hour and revenue denominators; convert amounts to constant prices; split branches into format groups. Produce the first branch scorecard.
- Days 61–90, decisions. For branches clearly above the group median (for example, more than 10% above) or weak on several indicators at once, isolate the cause. Set targets for three indicators and tie them to the monthly management meeting.
Conclusion
When margins tighten, bargaining over rent and payroll has limits; maintenance is a cost you can manage to the extent you measure it. Normalizing maintenance cost per branch, separating causes with five indicators and focusing on outlier branches makes visible the savings that the total figure hides.
Once work orders and costs are collected in one place by branch, these indicators stop being a report compiled by hand. Servista, our maintenance management software, can help you collect this data in one place; contact us for information and membership.
Sources
- TurkStat (TÜİK) Consumer Price Index, October 2026 bulletin, as reported by Alomaliye (in Turkish)
- PwC Türkiye, 2026 minimum wage and employer cost by sector (in Turkish)
- Ekonomi Gazetesi, requests to defer shopping-mall rent payments are rising, 30 September 2026 (in Turkish)
- İş Yatırım, Retail Sector Report, via hedeffiyat.com.tr (in Turkish)
- Vixxo, The First Trip Fix Crisis
- Vixxo, Managing Facilities Like Assets, Not Invoices
- Vixxo, Preventive Maintenance ROI
- CAPS Group, European Store Maintenance Strategy: 70/30 Split
- Nexdigm, Store Operations Procurement Spend Benchmarking
- APQC, Retail facilities maintenance and operations cost per square foot